Posts mit dem Label see conference #5 werden angezeigt. Alle Posts anzeigen

Dienstag, 20. April 2010

see #5 review: Hannes Koch, rAndom International

London-based art and design collective rAndom International was founded in 2002 by Hannes Koch, Stuart Wood and Flo Ortkrass. rAndom International have developed a series of artistic projects and installations that aim to re-interpret the “cold” nature of digital-based work by providing the viewer with the opportunity to have a more hands-on experience with technology. More recently, their work has investigated the potential of adding behavioural qualities to usually in-animate objects and environments. Apart from experimental works rAndom realizes commissioned works for clients such as Philips, Fiat and Nokia.
What does it mean to be a pixel?
- www.random-international.com

Examples:
Sticky - Instant labeling tape
Was designed as a simple, customisable, do-it-yourself signage system. By "blacking out" elements of a 14-segment display font on the tape, all you need is a black permanent pen to create your own temporary signs, labels and installations. Think re-naming your street after your loved one, moving house and labelling boxes, putting up official-looking signs or teaching your kids how to make letters...rolls are 65 metres.


PixelRoller
PixelRoller is a paint roller that paints pixels, designed as a rapid response printing tool specifically to print digital information such as imagery or text onto a great range of surfaces. The content is applied in continuous strokes by the user. PixelRoller can be seen as a handheld “printer”, based around the ergonomics of a paintroller, that lets you create the images by your own hand.


Temporary Graffiti Light Cans
The cans were originally commissioned by and developed for the Nokia Leave No Trace tour in 2005 / 2006. Based around the ‘contemporary’ graffiti capabilities of the LightRoller, we wanted to make part of the experience more accessible to the audience; following the success of the light pens that were part of the first presentation of the LightRoller, we further explored the ergonomics of the classic graffiti tool: the spray can. After some refinements,the aircraft grade aluminium cans look and feel like their analogue counterparts, just that they are working with nothing but light.

Temporary Graffiti: rAndom vs 3TTman and from rAndom International on Vimeo.


Temporary Printing Machine at Kinetica

Temporary Printing Machine Limited Edition from rAndom International on Vimeo.


Swarm Light Chandelier

SWARM Light Chandelier from rAndom International on Vimeo.


Fade to light installation
An awareness of the kinästhetic power of mirrors and light is the dominant characteristic that has been developed by the interactive art work ‘You Fade To Light’. It engages directly with aesthetic ideas of kinästhetic learning by actual physical involvement. But by learning it is not suggested that the work is in any way didactic, since most creative learning in life is developed through participating in play.

You Fade To Light / edit 1 from rAndom International on Vimeo.


http://www.random-international.com/you-fade-to-light-milan-2009/


Audience. Installation
In February 2010, rAndom went to the US to install the first copy of the Audience edition for a private collection. The installation is laid out on a long stretch of a custom designed plywood floor. For the first time it was possible to install it in a way that the mirrors are creating an autonomous play of light patterns on the wall.

Audience February 2010 - Unedited from rAndom International on Vimeo.


http://www.random-international.com/audience-private-collection/

Further Projects:
As part of the Honda F1 Drivers day for Rubens Barachello, rAndom international were invited to develop a site specific work to celebrate the end of an era of F1. The result was a 7x3m phosphorescent race track, the only F1 race track in Buenos Aires, albeit suited for miniture 1:24 scale F1 Radio controlled cars. The cars were custom fitted with UV diodes which left the racing line illuminating in the dark.
http://random-international.squarespace.com/buenos-aires-race-track-honda/

Resources:
http://www.pixelsumo.com/

Twitter Revisit Visualisation

Very nice real-time visualization during the see-conference #5:
"Revisit is a real-time visualization of the latest twitter messages (tweets) around a specific topic. Use it create your own twitter wall at a conference or an ambient display at your company or whatever other idea you come up with. In contrast to other twitterwalls, it provides a sense of the temporal dynamics in the twitter stream, and emphasizes the conversational threads established by retweets and @replies."

moritz.stefaner.eu - revisit - demo

see #5 review: Kent Demaine, OOOii

For the past fourteen years, OOOii has specialized in information visualization and future technology design for the Hollywood movie industry. They work for films like Minority Report, Star Trek, Mr. and Mrs. Smith, and The Island. And with technologies such as multitouch surfaces, gesture based interaction, real-time installations, augmented reality and game engines. Creative Director Kent Demaine began his career in the camera department as Cinematographer and photographer. He is an award winning VFX supervisor for commercial clients such as Apple, Porsche, Mini Cooper, and Sony, and he has designed award winning main title sequences including the currently airing CSI:NY. Kent participated in think tanks for the CIA and Microsoft Research. Prior to the film industry, he worked for Accenture as a Sr. Consultant responsible for large information systems design/implementation for clients such as Pacific Bell and the US Department of Defense.

OOOii | Designers of the Live Environment

Examples:
Minority Report


Star Trek

see #5 review: Nicolas Felton

Graphic designer Nicholas Felton is obsessed with data. He knows how many songs hes listened to and how much it costs him per mile to fly. Felton visualizes these numerous details in personal Annual Reports. At PopTech 2009, Felton examines what a weeklong-snapshot of New York Times front pages reveals about America.

Nicholas Felton | Feltron.com, Nummerical narratives.


Examples:
How many miles did i travel per
- Flight
- Feet
- Bike
Sensors
- Nike iPod Sport Kid
- Odometer
- Fitbit
Which music did i listen to?
- Last FM
- Twistory
- Mut (?)
Further:
- Which streets did i walk?
- Which brands did i use?
- First everything (of flight canceld due to a vulcano)
- Bills, Taxes
- Routines (Pills etc.)


Inspiration: Edward Tufte


Personal daily statictic services:
Daytum.com tracks everything, you want:
Whether you would like to tally an afternoon or a year, Daytum can help you collect and communicate the most important statistics in your life. From an up-to-the-moment personal dashboard, to a tabulation of an event, a home for sports scores, or as a corporate tool, the uses for Daytum may be limitless.

Daytum is free to use for as long as you like, but we also offer a Daytum Plus account for $4/month that offers additional features including the ability to collect and present more data, create pages and apply privacy settings to your account.

Designers motivation: Stories to tell.
Example: http://daytum.com/AndreasT


Nicolas Felton was inspired by the book Catch-22

Montag, 19. April 2010

see #5 review: Andrew vande Moere, information aesthetics

Andrew Vande Moere is a senior lecturer affiliated with KULeuven, Belgium, and the University of Sydney, Australia. His research interests include data visualization, interaction design, media architecture and physical computing. Andrew is also the sole author of the "information aesthetics" weblog, a website collecting compelling representations of information that are engaging as well as insightful.

information aesthetics - Information Visualization & Visual Communication
Look at: http://www.benfry.com/

Review of speech:

Al Gore, climatic change (watch 8:55 h)


Web2DNA

Grafic web2dna.png

WEB2DNA will take you website, analyze it, crunch it to little bits and spit it out as a graphic representation of a human DNA.
The brightness of the lines is determined by the importance of the tags in terms of structure.

- H1 is brighter than H2, which is brighter than H3.
- TABLE is brighter than TR, which is brighter than TD tags.
- Images and flash elements appear as 70% white.
- New HTML tags like STRONG and EM is brighter than older ones like B and I
- UL, OL and DL is brighter than their LI, DT, DD
- DIV layout is brighter than table layout
http://www.baekdal.com/web2dna/


Visualisation: Rice population demographics
1 corn of rice = 1 victim of war

a physical visualization of the world population demographics, by mapping 1 grain of rice to represent 1 human being. in the "of all the people in all the world" installation, population statistics are separated out in different piles to juxtapose compelling social phenomena, such as the comparison of all the prisoners in the world versus all the people in gated communities (roughly equal).


Installation: news casualties as candy

An art installation that represent the casualties in news reports as an ever-increasing random constellation of bright yellow candy. a computer program continuously scans the headlines of 4,500 English-language news sources around the world, looking for people who have been reported killed. the algorithm determines the number of deaths, & instructs a specially designed ceiling-mounted mechanism built with Lego NXT parts to drop one yellow BB per person. as a result, BBs will accumulate on the floor, ultimately forming a sort of aesthetic monument.


http://caleblarsen.com


Make data visible: power-aware cord
Bild: http://infosthetics.com/archives/powerawarecord.jpg
An electrical cord that acts as an ambient display, as the amount of energy is displayed through dynamic glowing patterns produced by electroluminescent wires molded into its transparent shell. this cord attempts to increase consumer awareness regarding energy consumption, by a new intuitive way of representing energy in domestic, electric products. also see dangling string. [tii.se]


Twitter Earings? Image?


Data visual sports jersey:
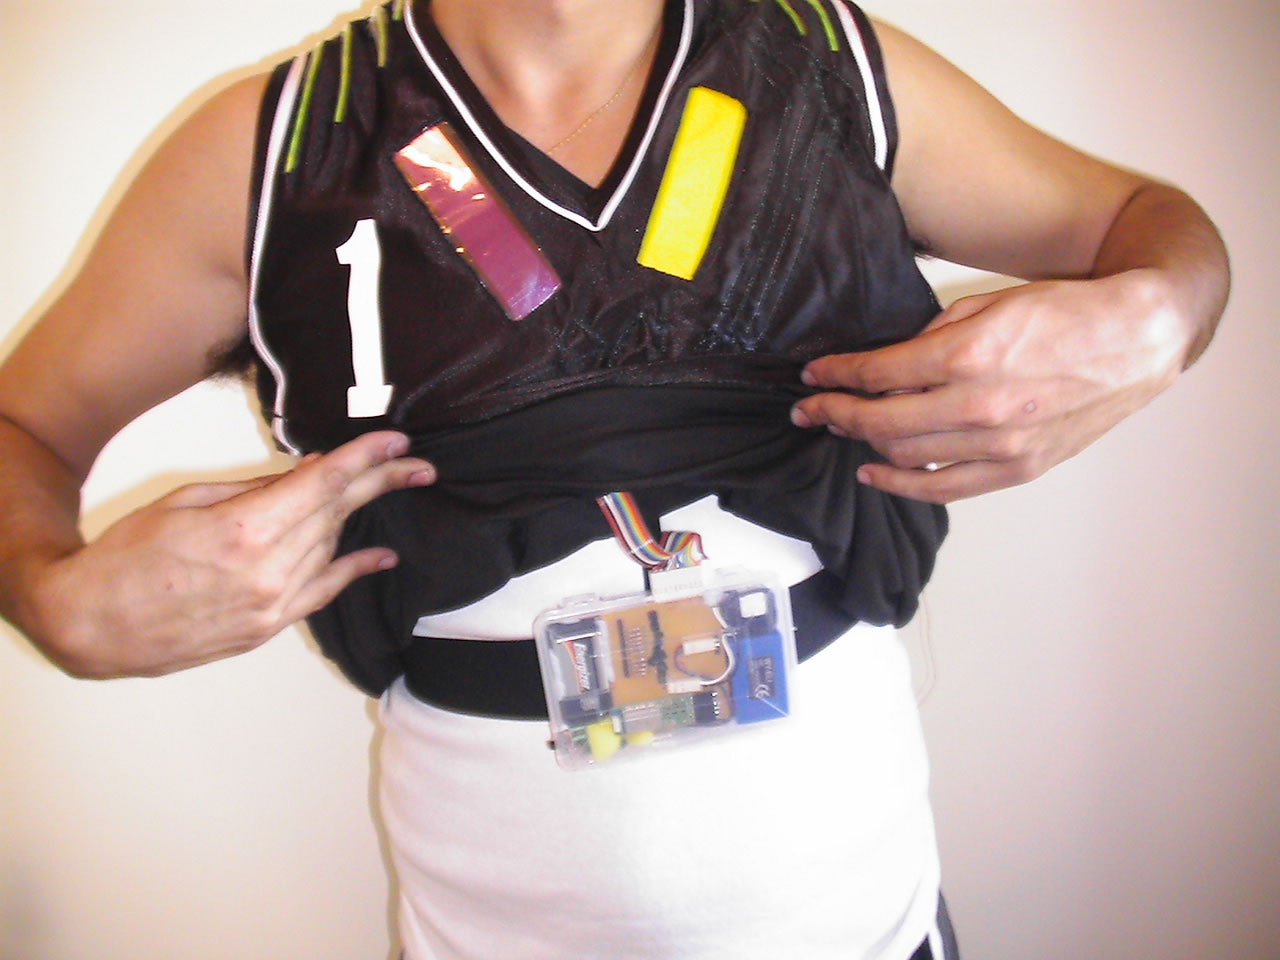
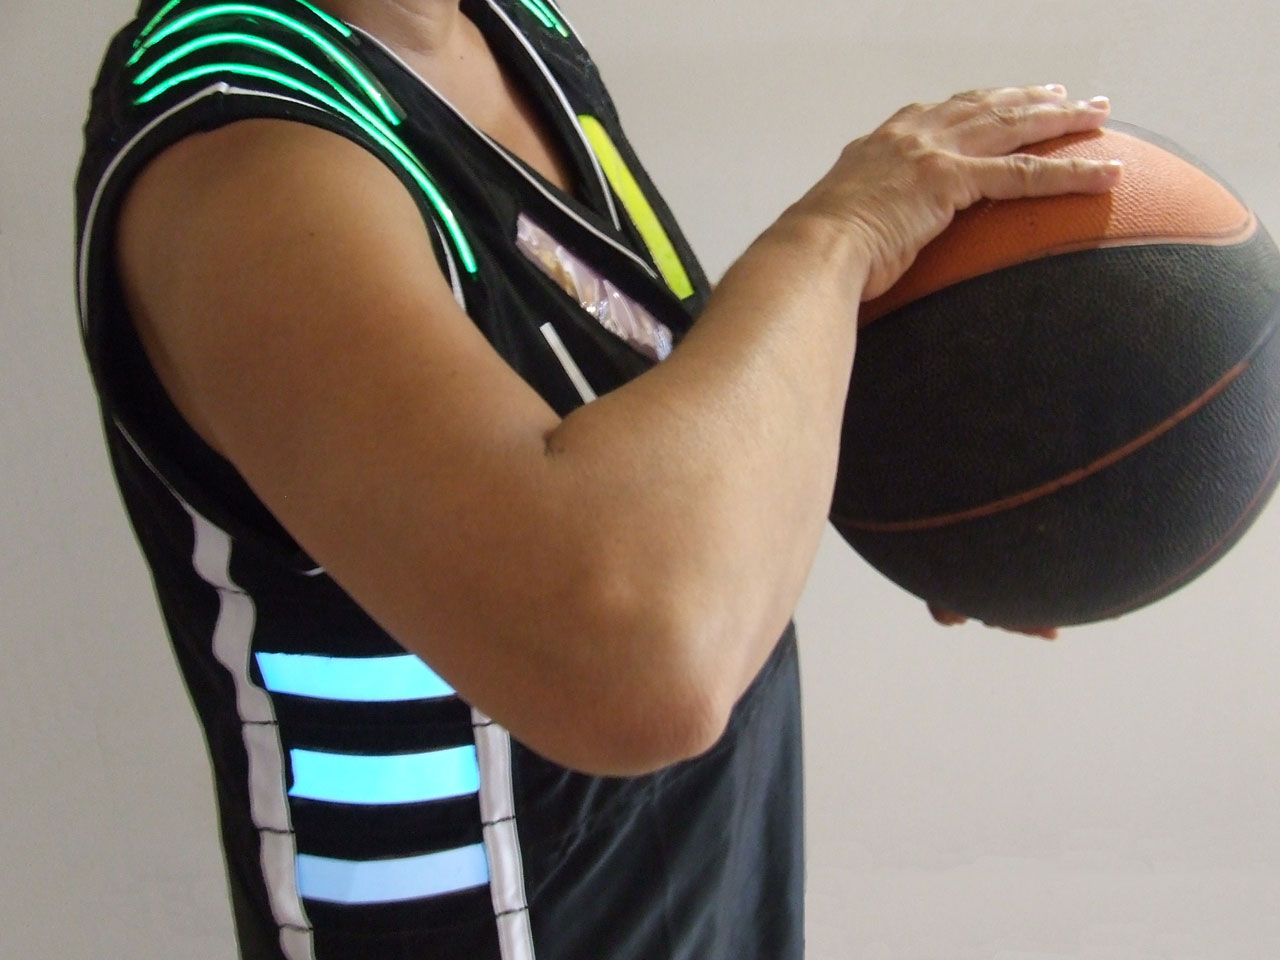
we recently designed & implemented a set of 4 electronically-enhanced basketball jerseys with different EL-panels that light up according to game-related data, such as fouls, score, time clock, etc. the jerseys are wirelessly controlled from a central computer by a game official in real time.
the TeamAwear system aims to actively enhance the awareness & understanding of the actual team sport situation for its different stakeholders, including athletes, referees, coaches & spectators.


Links:
- http://www.mitchellpage.com.au/teamawear/index.html
- http://www.smh.com.au/news/technology/technology-gets-a-guernsey/2006/11/20/1163871338586.html?page=fullpage#contentSwap1
- http://wwwfaculty.arch.usyd.edu.au/kcdc/


An impressive online sharing project, developed by the renown IBM Visual Communication Lab, to encourage sharing & conversation around visualizations. the goal of "Many Eyes", which is still in 'alpha phase', is to "democratize visualization, enabling anyone on the Internet to publish powerful interactive visualizations & start their own data conversations."
http://manyeyes.alphaworks.ibm.com/manyeyes/


City-scale energy consumption

First 30 seconds of Green Cloud goes online from HeHe on Vimeo.


An intriguing eco-visualization concept, originally blogged in April 2005, recently seems to have become reality. "Nuage Vert" ("Green Cloud") is a city-scale light installation representing the actual energy consumption (& its accompanying environmental pollution?) of a coal burning power plant.
More: http://www.pixelache.ac/nuage-blog/


Sensing City Amsterdam, Persuasive Data Visualisation

A city has its own rhythm that affects the life of its people and is at the same time created by them. Bus schedules, traffic lights and the turn signals of cars are familiar patterns to the citizen. This interplay between creation and inspiration is also at the heart of all music. Making music means translating impression into sound, listening to music means transforming sound into impression.

So what happens if we allow these urban rhythms to occasionally have a direct influence on the musical performance of an eleven-piece-ensemble?

As the movement of cars outside the concert venue triggers the rhythms that are being played, the urban dwellers not knowingly become part of the composition, the city becomes audible through the musicians. This process happens in real-time and is guided by the framework of a video-installation that surrounds the ensemble during the performance of sensing city.

Sensing City Preview from LevenMusterCollective on Vimeo.


#Sonification

see #5 Review: Dieter Brell, 3deluxe

Wir wollen die Zeit der Menschen gestalten
Dieter Brell, 3deluxe :: Transdisciplinary Design

Projects:
Kinder und Jugendpavillion "Scape" auf der Expo 1998


Leonardo Glass Cube


(Die Kommentare ;-)


VW Autostadt Atmosphere auf der IAA


Pavillon Cyberhelvetia auf der EXPO 02

In Anlehnung an eine traditionelle Schweizer Badeanstalt wurde der 'Cyberhelvetia'-Pavillon auf der Expo.02 in Biel als Ort der persönlichen Begegnung und Kommunikation konzipiert. Kommunikation kann heutzutage auf vielfältige Art und Weise stattfinden, unabhängig von Ort und Sprache. Auch ein gemeinsames Bad benötigt kein reales Wasser mehr: Ein blau leuchtender Glasquader ersetzte das reale Schwimmbecken – die Ausstellungsbesucher tauchten kopfüber in die vielschichtige Atmosphäre einer virtuell erweiterten Wirklichkeit und badeten in Licht und Klang.
Film: http://www.3deluxe.de/projekte --> Film


Football Globe Germany


3deluxe gestaltete den Innenraum des fußballförmigen Pavillons zu einem poetischen Informationswandler, der mittels einer interaktiven 360°-Projektion die augenblickliche Fußballbegeisterung der Ausstellungsbesucher vor Ort und von Menschen aus aller Welt widerspiegelte. Diese 40m lange Collage aus bewegten Bildern, grafischen und textlichen Elementen wurde durch die Einbeziehung des Publikums zu einem Meilenstein der Ausstellungskultur.Interaktive Spielinstallationen ließen die Teilnehmer in unterschiedliche Rollen aus der Welt des Fußballs schlüpfen oder informierten sie über vergangene und zukünftige Weltmeisterschaften.
(Made with vvv)


Cocoon Club, Frankfurt, Corporate Design

Der CocoonClub wurde als avantgardistisches Experimentierfeld für die Transformation von Raum und Wahrnehmung konzipiert. In einem interdisziplinären Prozess gestaltete 3deluxe alle Elemente zu einem ganzheitlichen Raum, in dem sich Architektur, grafisches Programm sowie Medien- und Webdesign wechselseitig beeinflussen. Die perforierten Wandflächen des triangulären Hauptraumes erinnern an eine permeable Zellmembran, durch deren Öffnungen der Besucherfluss stattfindet. Sie ist wegen ihres mehrschichtigen Aufbaus und ihrer Oberflächenstruktur das signifikanteste architektonische Element des Clubs. Sie wird mit einer bewegten 360°-Projektion bespielt, die in Echtzeit mit dem DJ-Set abgestimmt werden kann.

see #5 Review: Gideon Obarzanek, Chunky moves


Gideon Obarzanek from http://www.chunkymove.com/.
Founded in Australia by choreographer Gideon Obarzanek, his company Chunky Move has earned an enviable reputation for producing a distinct yet unpredictable brand of genre-defying dance performance. Obarzanek’s works have been diverse in form and content and include stage productions, installations, site-specific works and film. His multi-award winning works have been performed in many festivals and theatres around the world in the U.K, Europe, Asia and the Americas."

Chunky moves was inspirated by the book "Painting by Numbers",
#Dancing Agent States.

Dienstag, 9. Februar 2010

see conference #5

Program:

11:00 - 12:00 KEYNOTE, NN
12:00 - 12:45 HANNES KOCH, rAndom International, London
12:45 - 13:45 BREAK
13:45 - 14:30 JOSHUA PRINCE-RAMUS, REX architects, New York
14:30 - 15:15 NN
15:15 - 16:15 BREAK
16:15 - 17:00 KENT DEMAINE, OOOii, Hollywood
17:00 - 17:45 NN


11:00 - 12:00 KEYNOTE, PROF. DR. HERBERT W. FRANKE, Bildkultur vs. Sprachkultur
12:00 - 12:45 GIDEON OBARZANEK, CHUNKY MOVE, MELBOURNE
12:45 - 13:45 BREAK
13:45 - 14:30 ANDREW VANDE MOERE, SENIOR LECTURER, SIDNEY AND LEUVEN, BELGIUM
14:30 - 15:15 NICHOLAS FELTON, DESIGNER, NEW YORK
15:15 - 16:15 BREAK
16:15 - 17:00 KENT DEMAINE, OOOii, Hollywood
17:00 - 17:45 HANNES KOCH, rAndom International, London

www.see-conference.org

Montag, 4. Januar 2010